
international reports

visual

academic research

news articles
VISUALIZATIONs PORTFoLIO
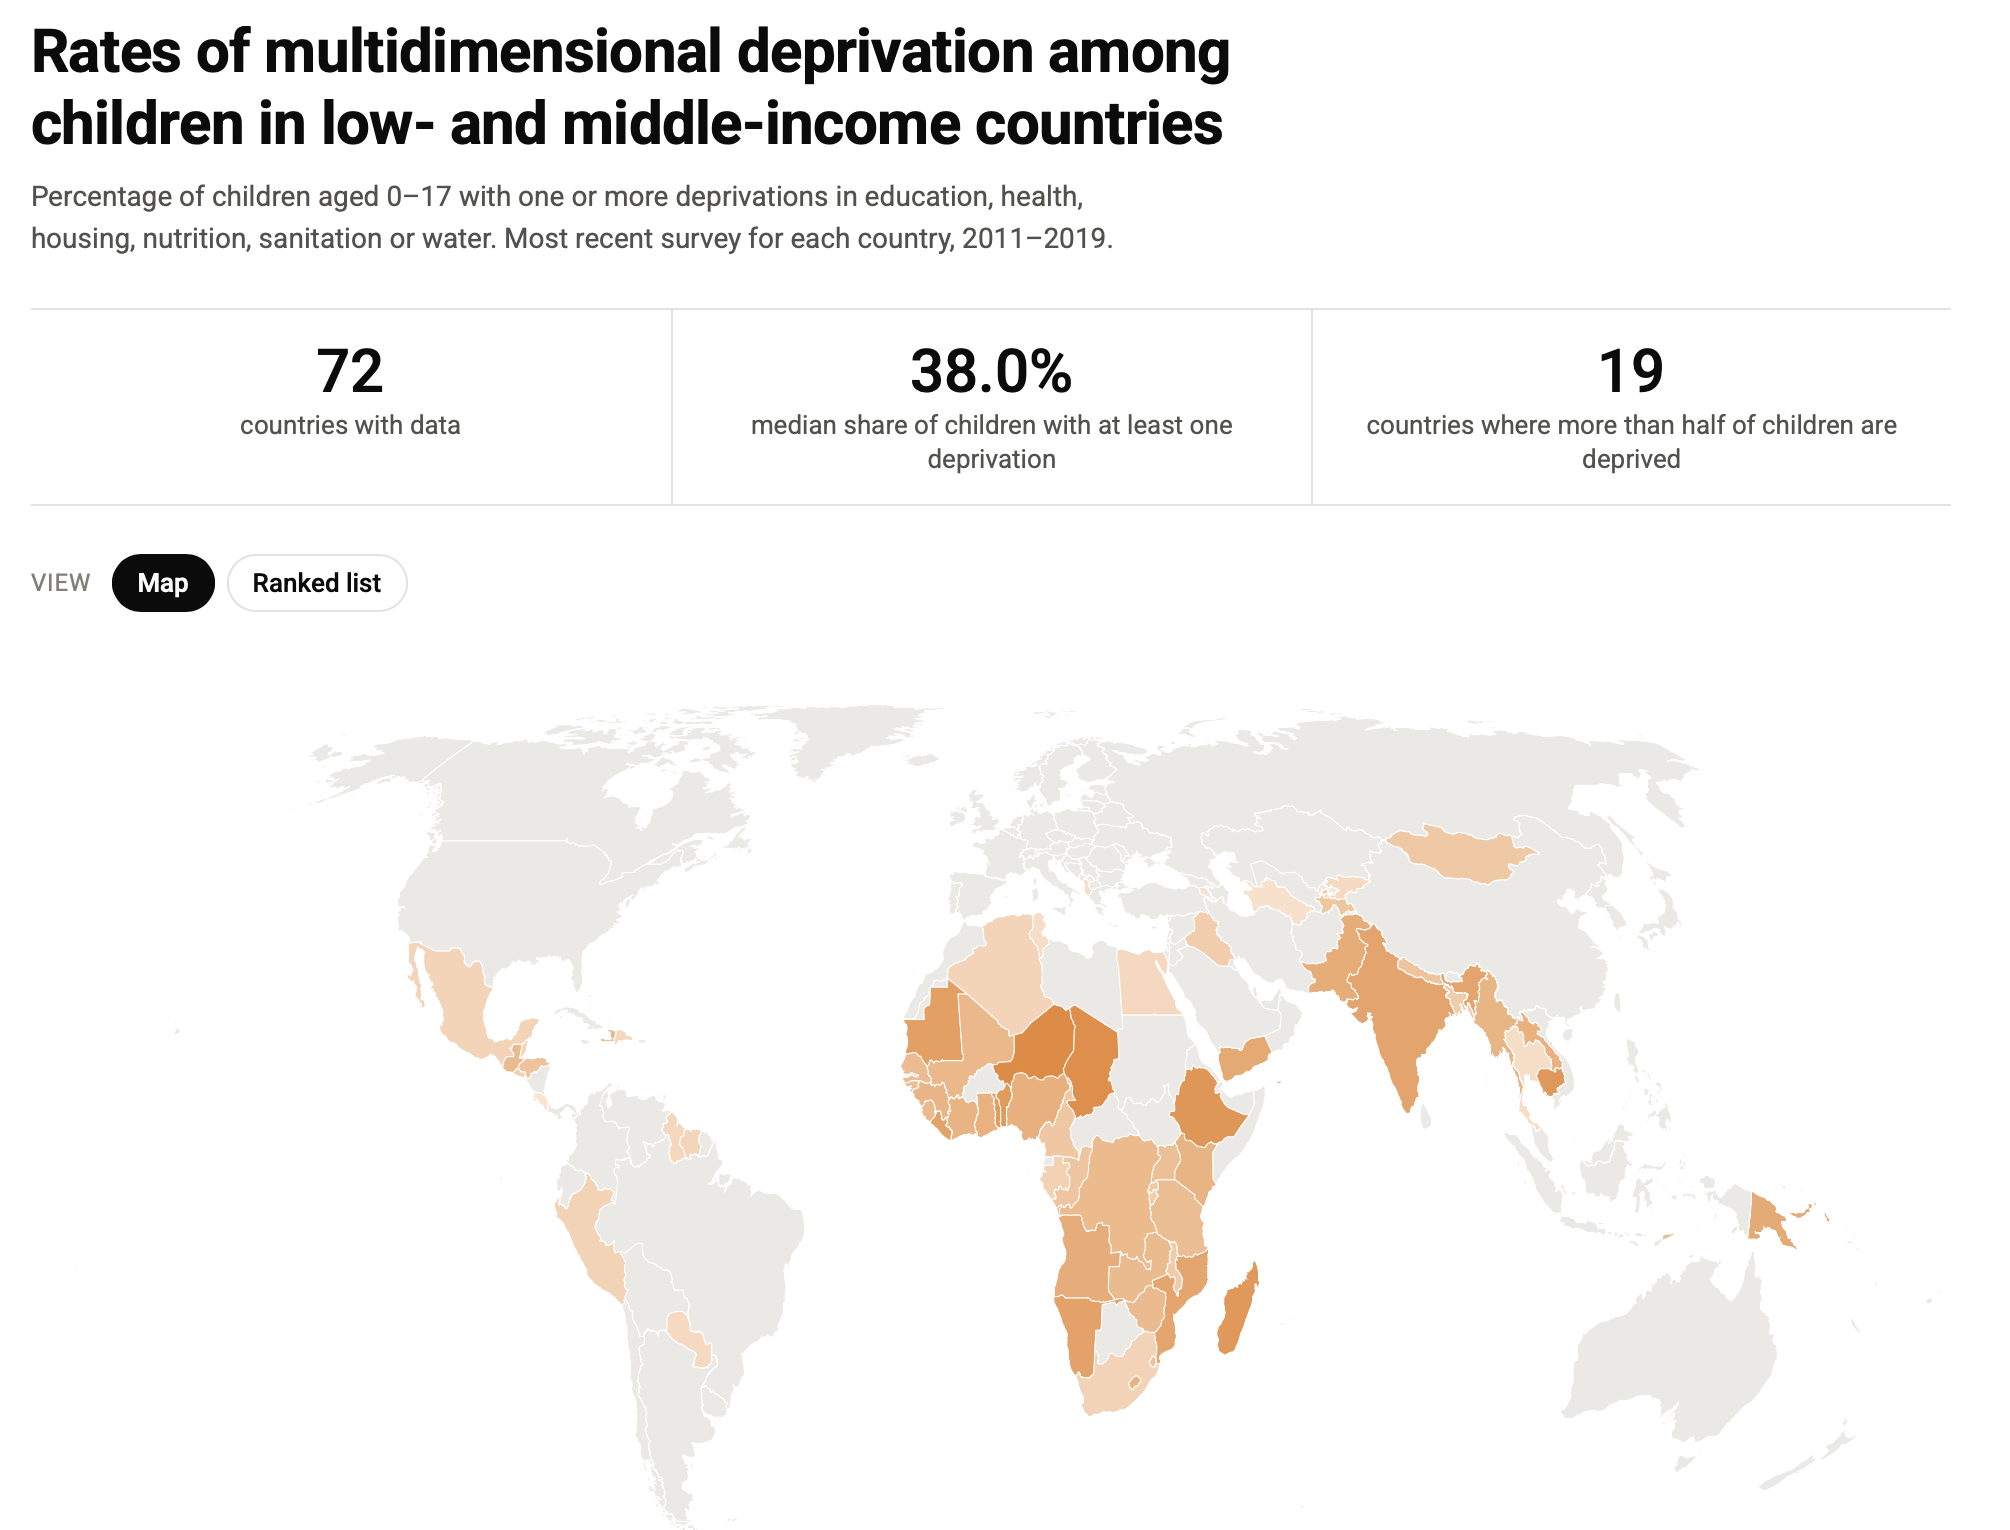
Interactive map showing rates of multidimensional deprivation among children in low- and middle-income countries, 2011 - 2019.
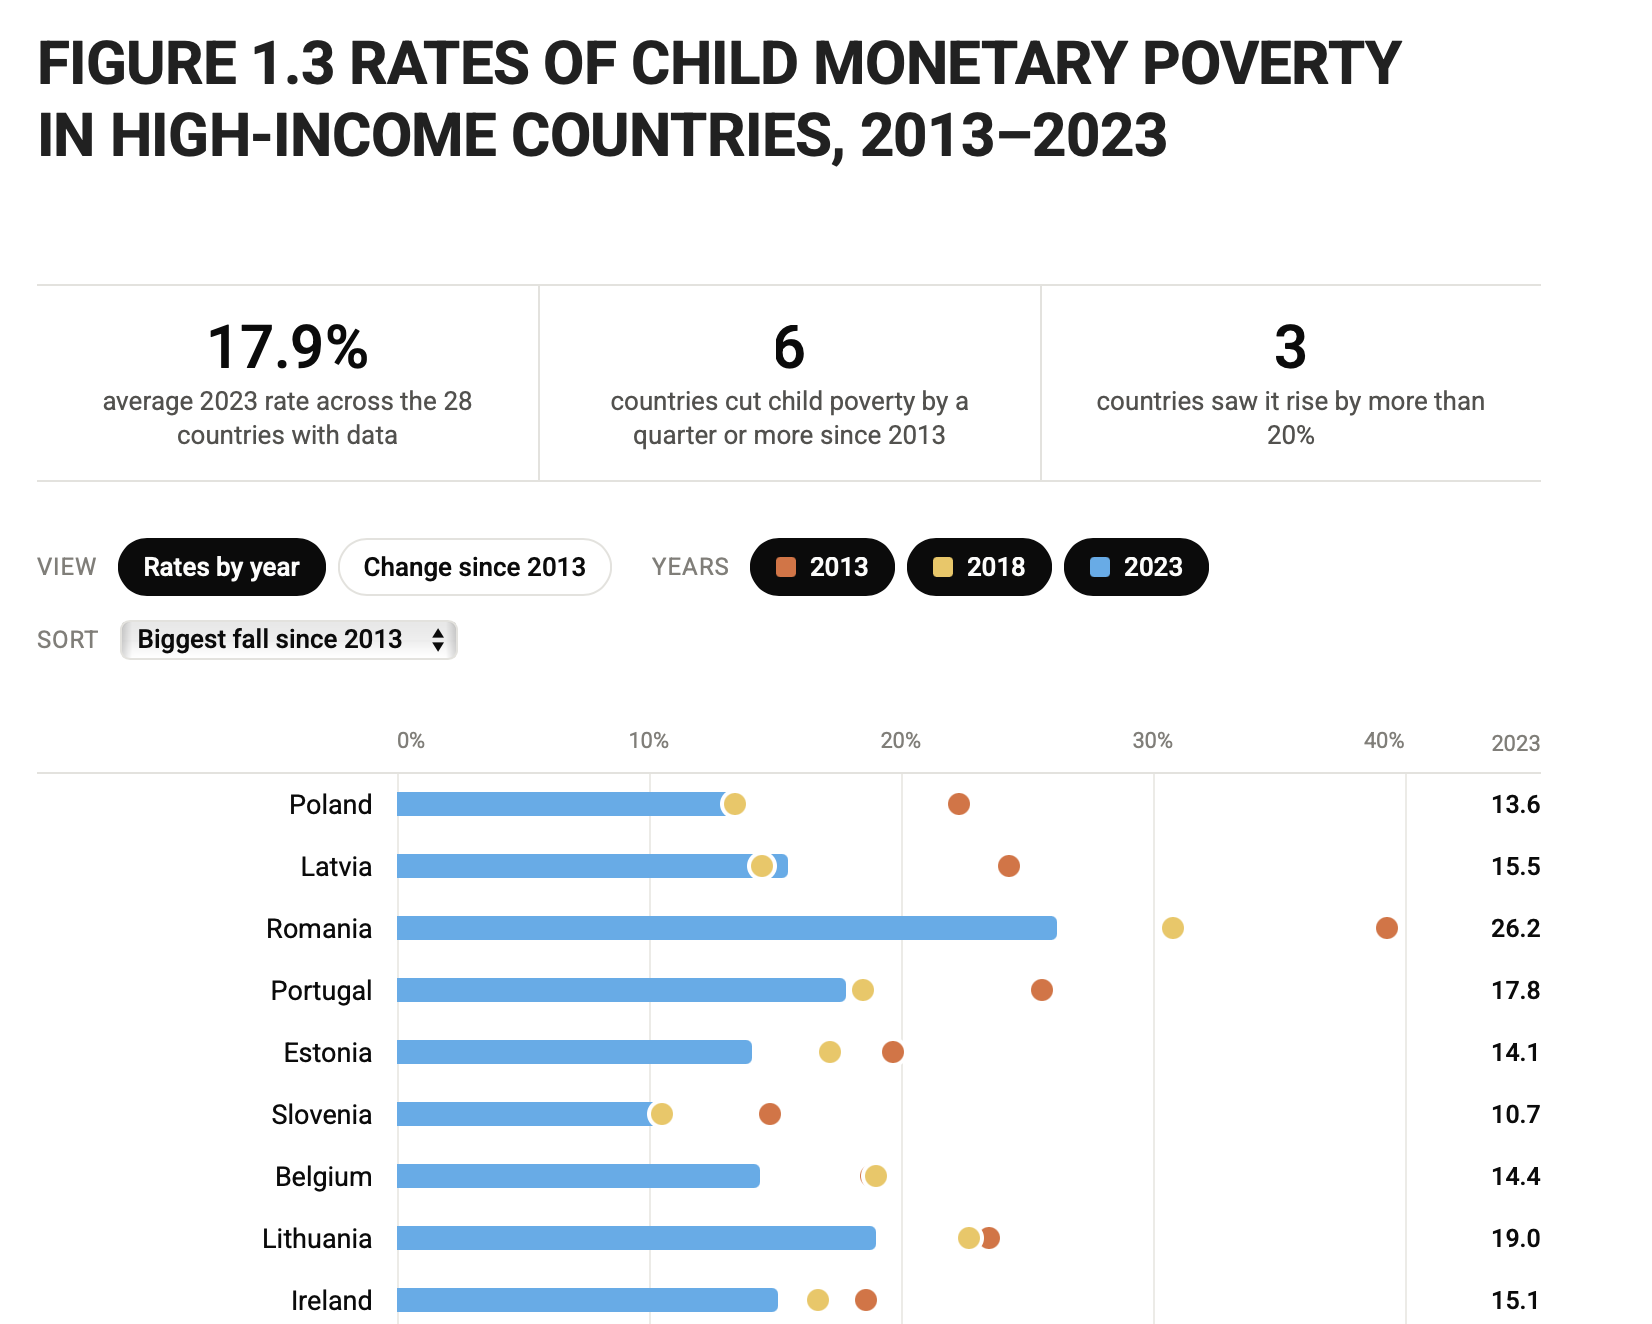
Interactive data visualization of the bar graph showing rates of child monetary poverty in high-income countries, 2013-2023.

One year of education disruption. (Published on UNICEF Data, March 2021)
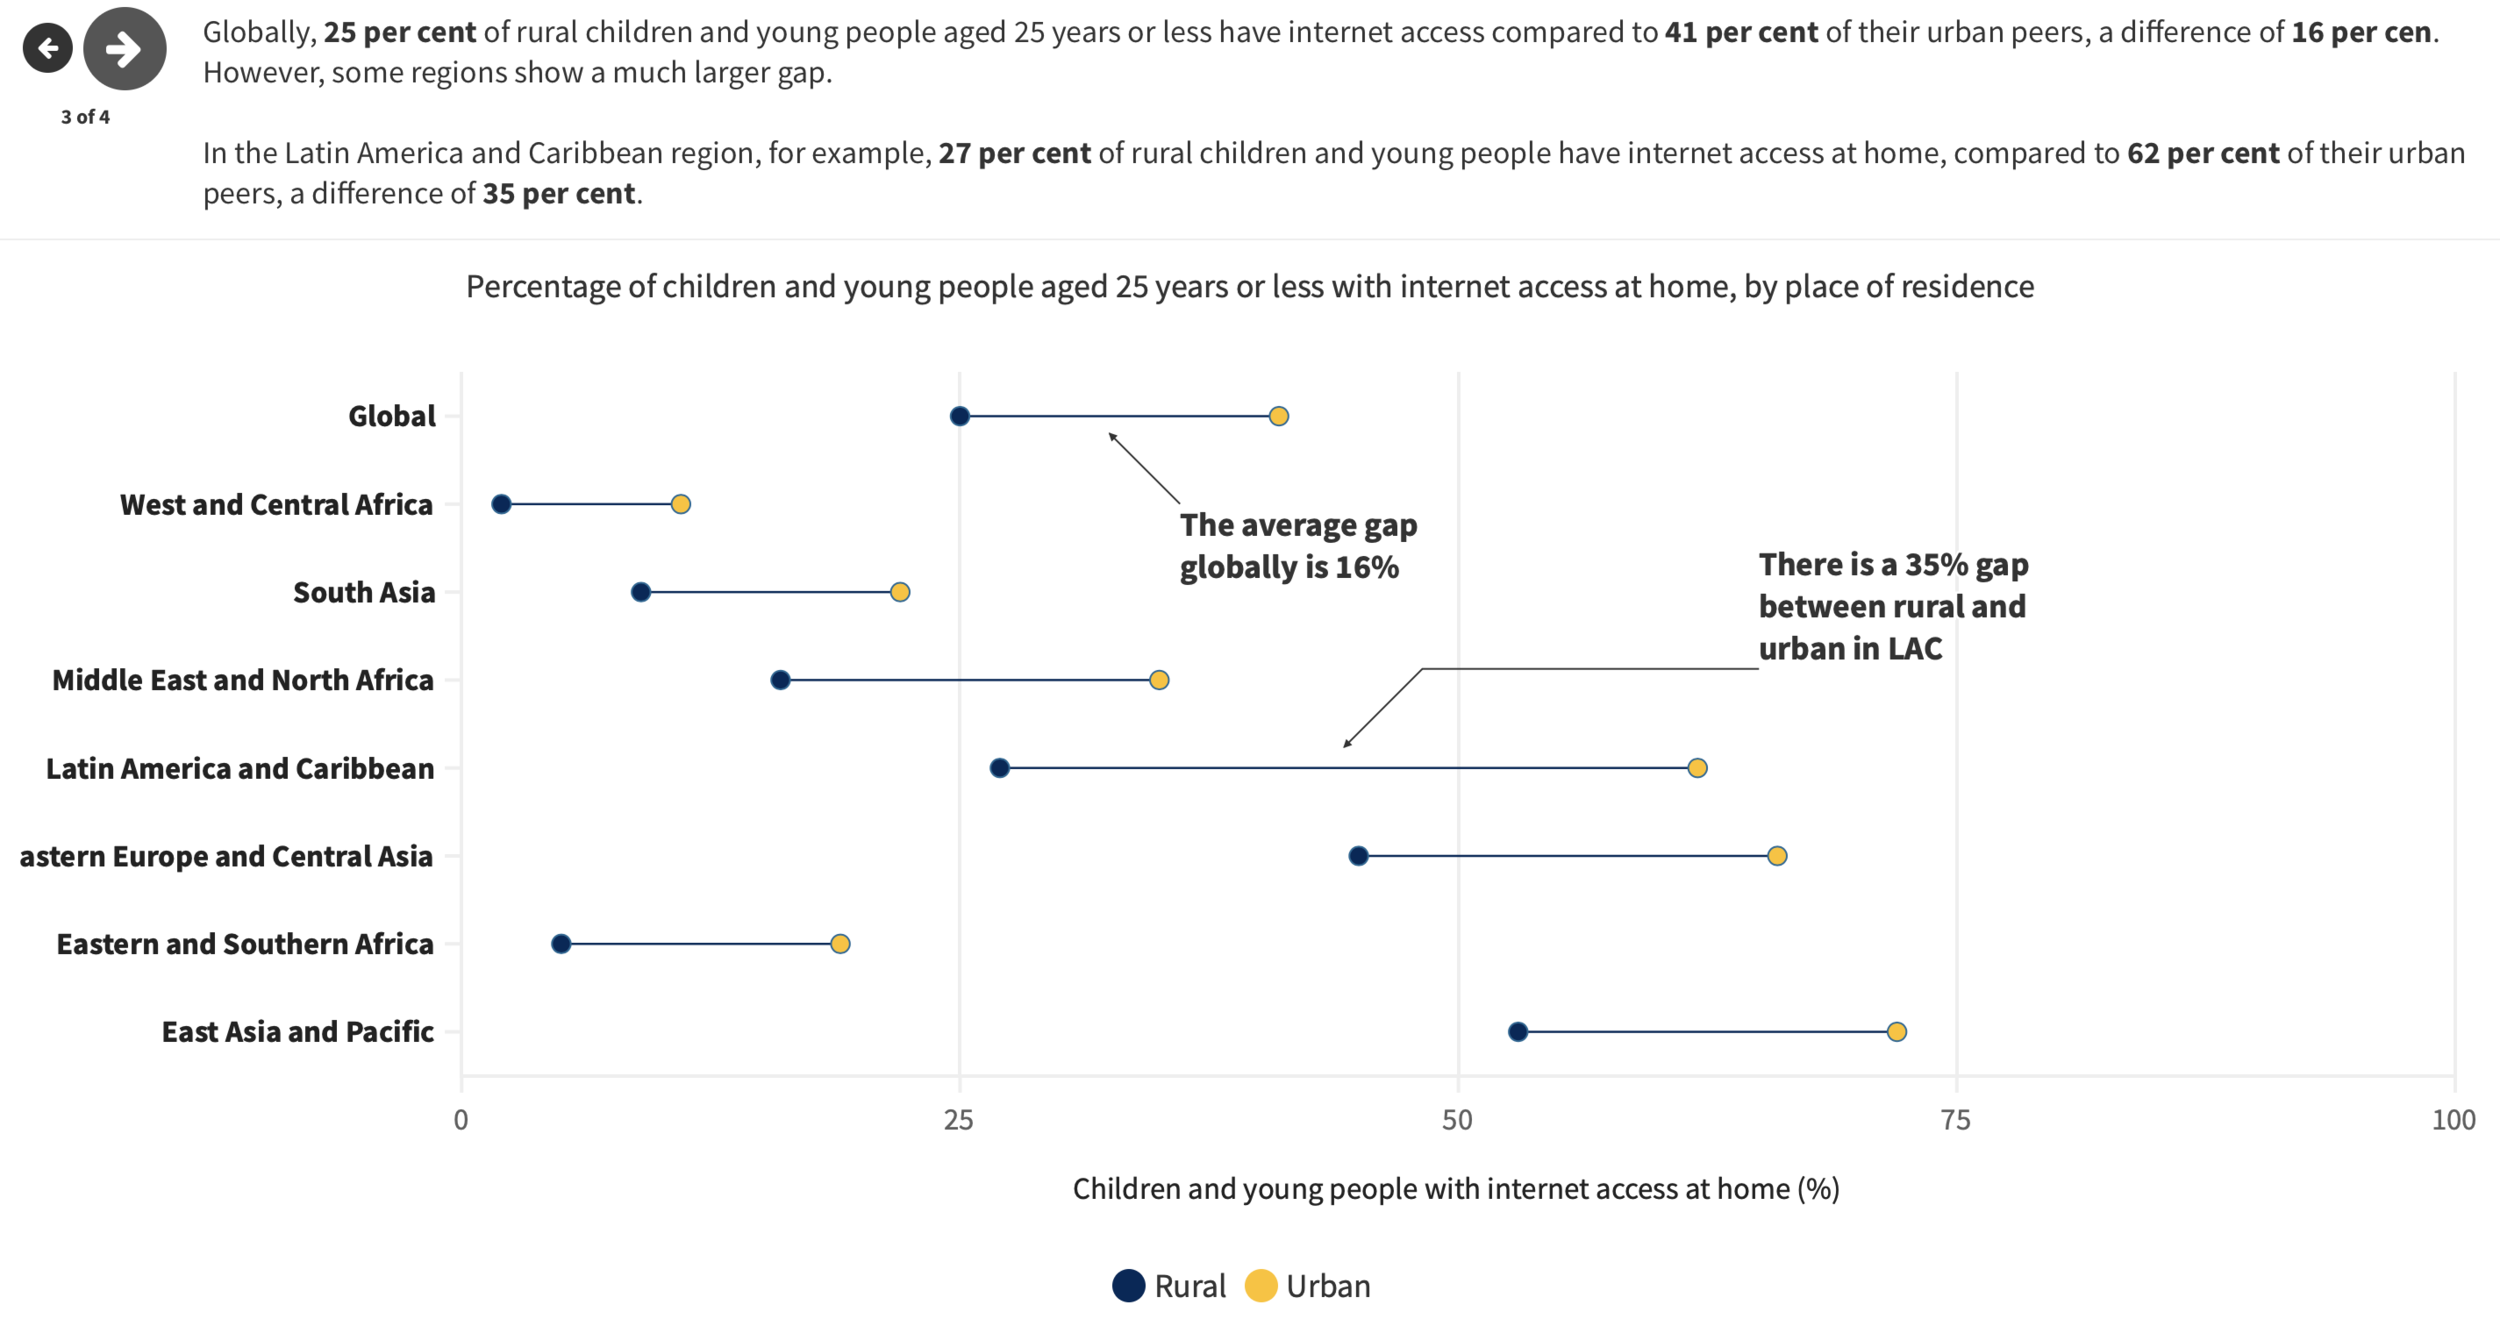
Estimating digital connectivity during the COVID-19 pandemic. (Published on UNICEF Data, December 2020)

An urgent call to transform sanitation for better health, environments, economies and societies. (Published on UNICEF Data, November 2020)

United Nations Inter-Agency Group for Child Mortality Estimation (UN IGME) report (Published on UNICEF Data)

The risks and challenges for internally displaced children and the urgent actions needed to protect them. (Published on UNICEF Data, May 2020)

A global analysis of the potential reach of remote learning policies. (Published on UNICEF Data, April 2020)
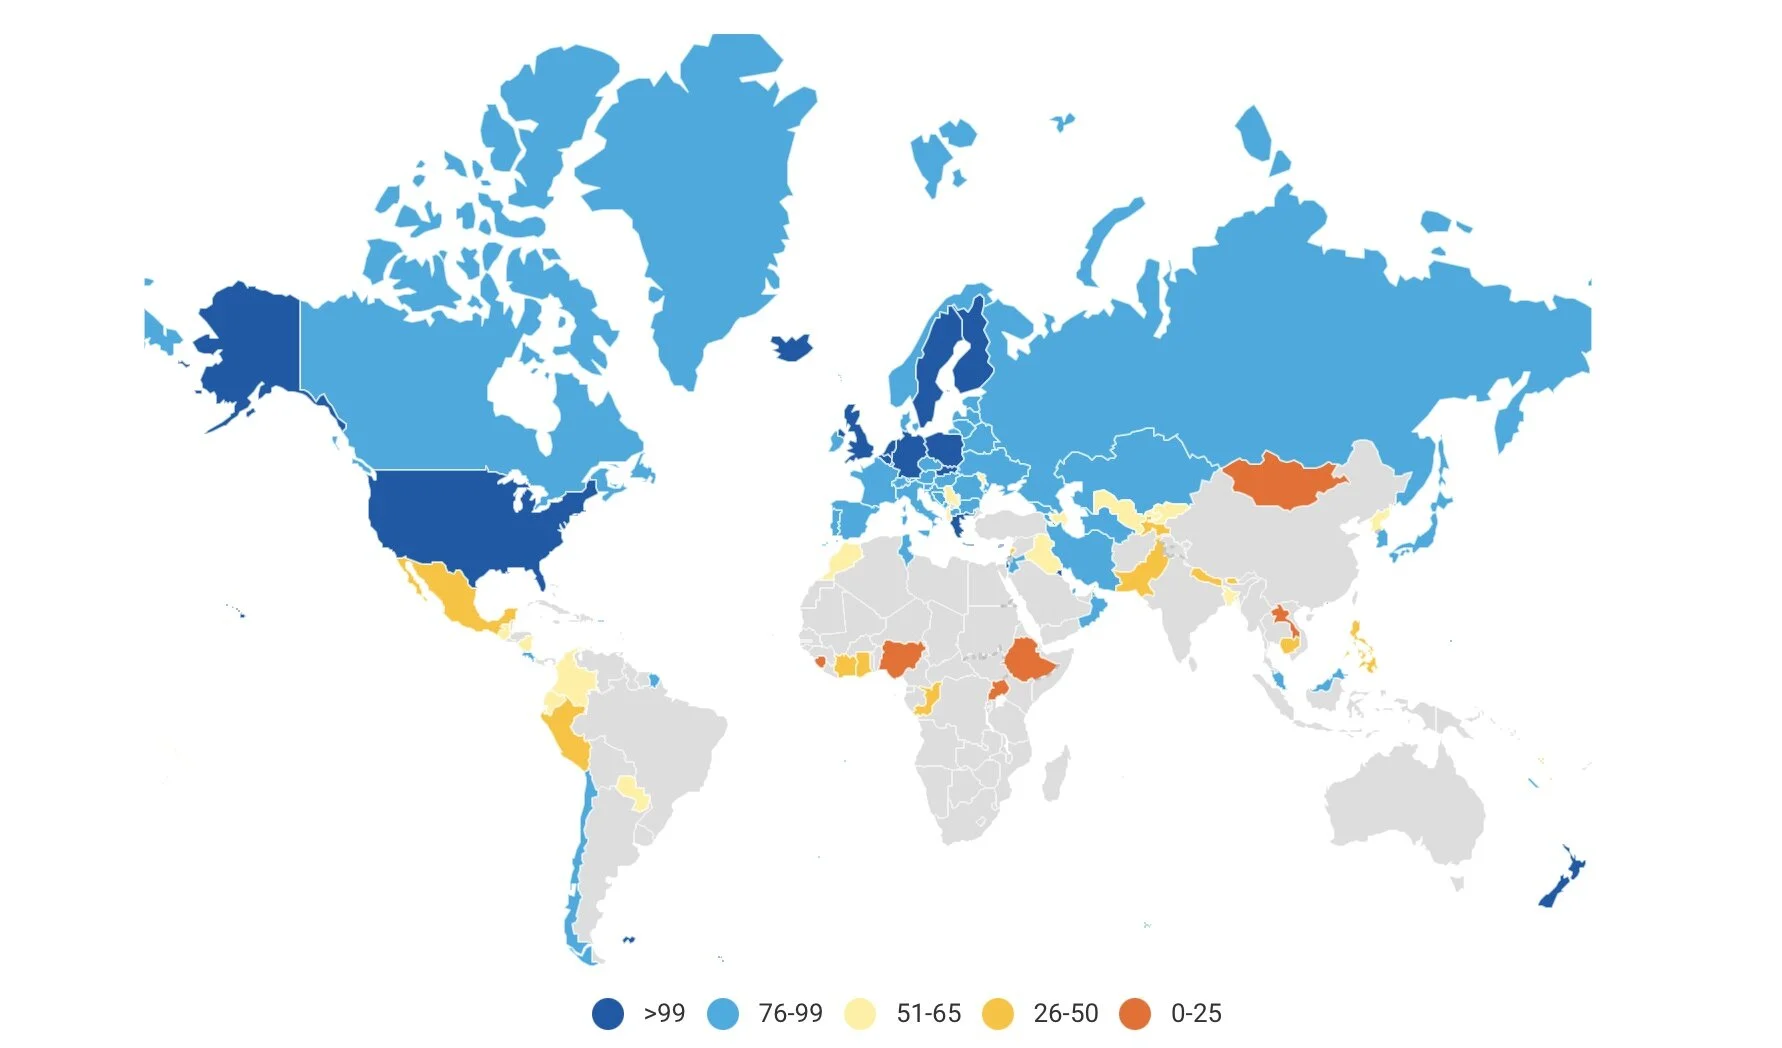
Special focus on inequalities (Published on UNICEF Data, June 2019)

[UNICEF] Workforce and Recruitment Report (Q3 2018)
I wrote, edited and designed the third quarter report on workforce and recruitment practices in UNICEF. Analysis was done in MS PowerBI and design was finalized in Adobe InDesign. (A full report is not available as the content is internal to UNICEF).